RESEARCH NOTE 002 / 16 OCTOBER 2026
Electricity.
Industry.
What scale requires.
Canada can build major energy infrastructure. What would it take to power a much larger productive economy?
Site C gives us a recent engineering reference: reported generation, construction time and project costs. We use it to calculate industrial electricity requirements. A feasible national expansion still needs a portfolio of sites, technologies, people and investments.
01 / A Canadian engineering reference
Production we can
put numbers on.
BC Hydro reports 3,574 GWh of Site C generation in fiscal 2026. The reported long-run average is 5,100 GWh a year. These describe different conditions.
| Reported measure | FY2025 | FY2026 |
|---|---|---|
| Actual generation | 1,308 GWh | 3,574 GWh |
| Year-end generating capacity | 767 MW | 1,230 MW |
Power and energy answer different questions.
MW measures power at a moment. GWh measures electricity produced over time. Year-end capacity does not establish how much energy was available throughout a commissioning year.
A reference with a specific site.
The 5,100 GWh average benefits from existing Williston Reservoir storage. It is not a guarantee for any future year, a replication plan or an allocation available to a new industrial customer.
Sources: BC Hydro annual report, physical PDF page 137; Site C lessons summary, page 4. The difference between actual and long-run average generation is not an estimated performance shortfall.
02 / Make industrial ambition measurable
A continuous gigawatt
needs 8.76 TWh a year.
That load is below the reported 1,230 MW capacity, yet requires more annual electricity than the 5,100 GWh average reference. Both constraints matter.
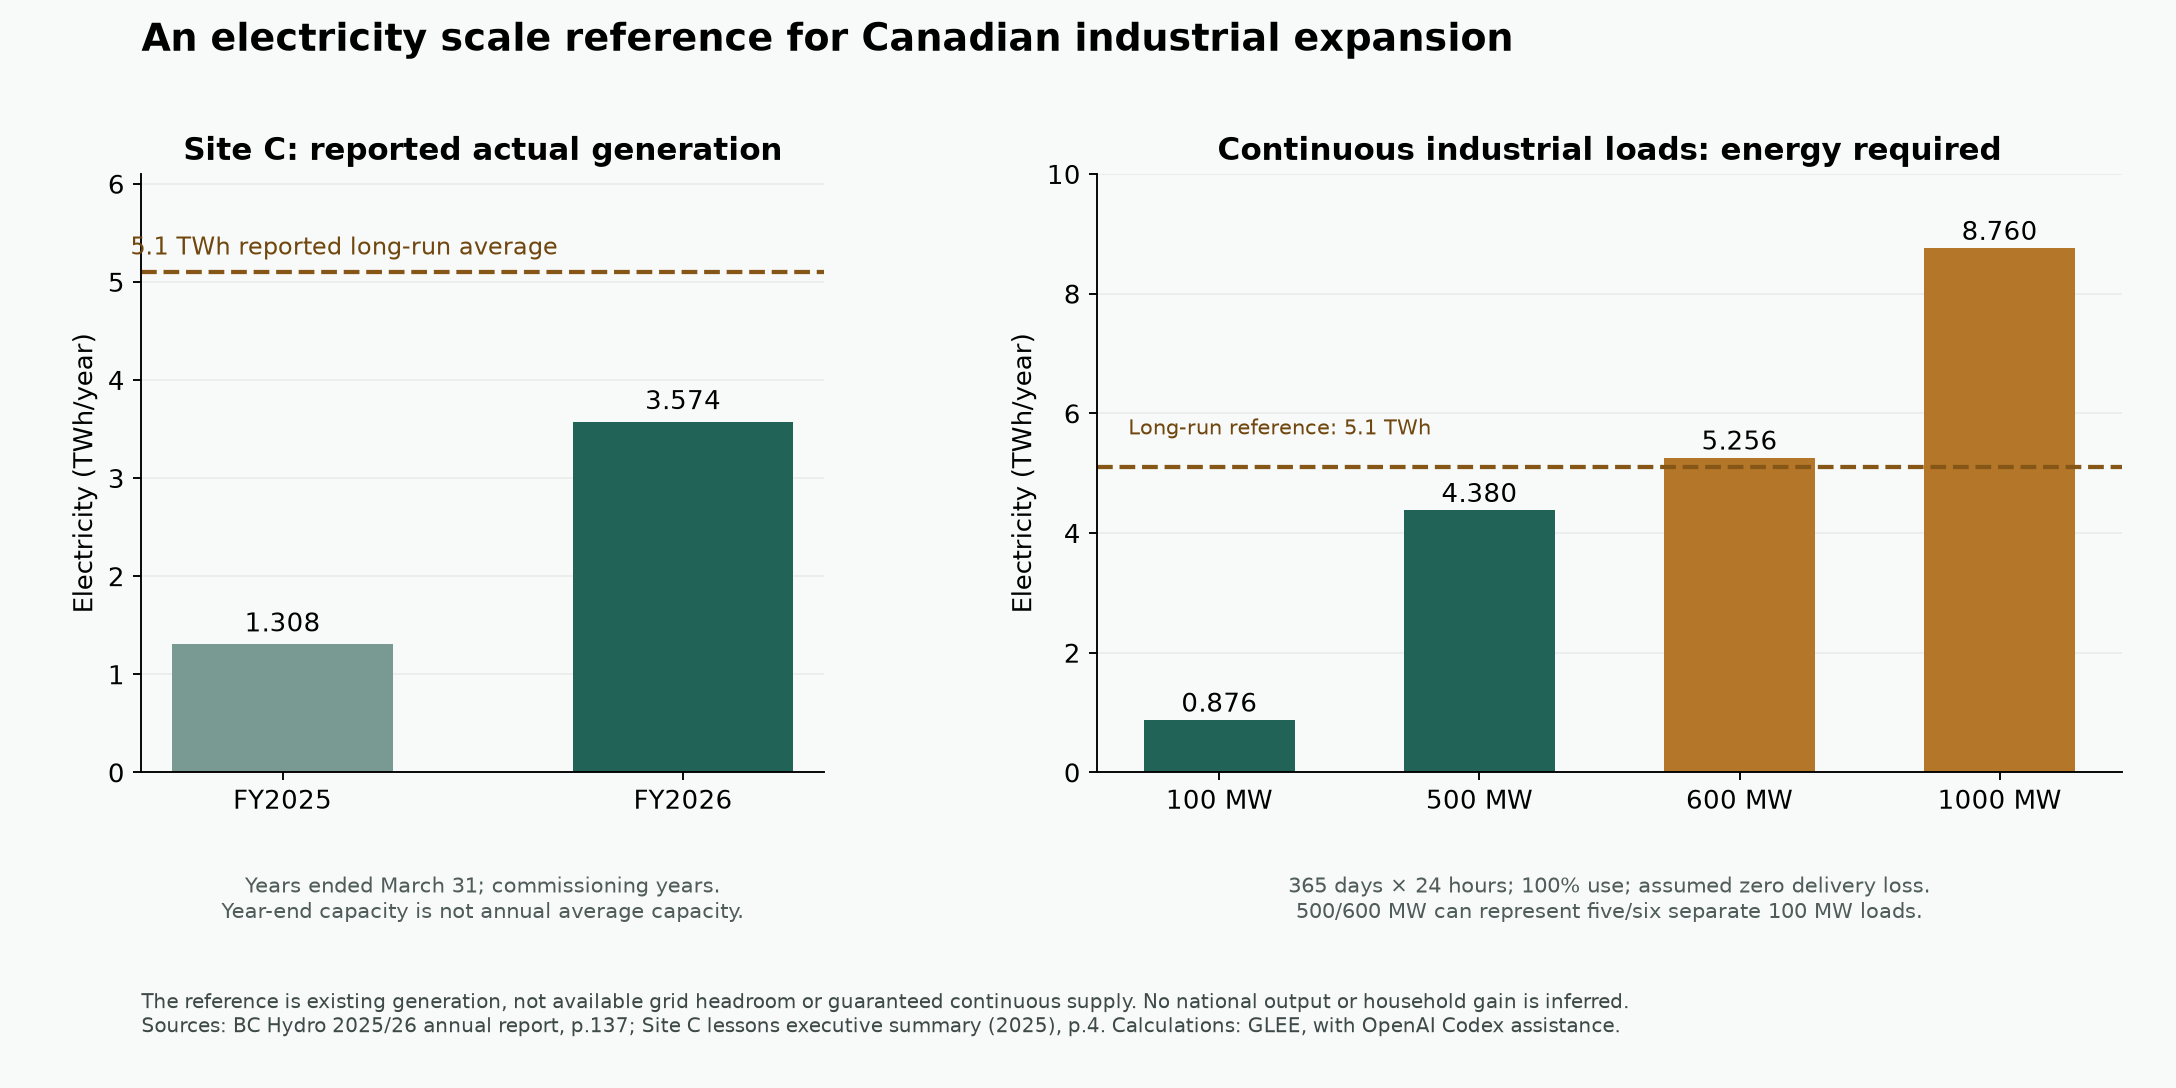
| Continuous load | Annual energy | Relative to 5,100 GWh |
|---|---|---|
| 100 MW | 876 GWh | 0.172× |
| Five 100 MW loads | 4,380 GWh | 0.859× |
| Six 100 MW loads | 5,256 GWh | 1.031× |
| 1,000 MW | 8,760 GWh | 1.718× |
Reproduce the arithmetic and inspect its limits
Annual generation required in MWh = meter-side MW × hours in the calendar year × utilization ÷ (1 − assumed delivery-loss fraction). The examples use 8,760 hours and zero loss. A 5% assumed loss raises a continuous 1 GW load's generation requirement to about 9,221 GWh. This is a scalar scenario, not a grid-flow model.
Five continuous 100 MW loads fit a hypothetical 5,100 GWh energy pool; six exceed it. A 1,300 MW load at 10% use fits that annual-energy screen but exceeds the 1,230 MW peak reference. Fitting either or both screens does not establish money, workforce, transmission or reliable supply. The downloadable data retain these unknowns.
We do not derive an annual capacity factor from year-end capacity, count existing electricity again as a new resource, or infer a national project count from energy equivalents.
03 / Resources and elapsed time
A large project.
A long construction path.
Construction began July 27, 2015. The first generating unit entered service October 27, 2024; the final unit followed August 8, 2025.
| Cost measure | CAD billions |
|---|---|
| Incurred project amount | 14.917 |
| Forecast remaining | 1.083 |
| Forecast total | 16.000 |
Operating units, remaining work.
The construction-to-final-unit span was 3,665 days. Fully operating units do not mean every contract and cost is closed. The forecast total remains an estimate.
Keep the cost basis intact.
These mixed project amounts include capital, regulatory deferrals and certain operating expenditures. They are not a current replacement quote, a price in constant 2024 dollars or a full lifecycle electricity cost.
Cost categories and an accounting-period correction
The progress report records CAD 13.014 billion of construction and indirect costs, plus CAD 1.903 billion in a combined interest-during-construction and contingency category. We retain the combined category rather than labeling it all interest or pure resource cost.
The annual report separately describes CAD 13.20 billion placed into service in the prior fiscal year, FY2025. Our source review corrected an initial FY2026 label before this edition. That accounting transfer is distinct from the total project amount. Recurring lifecycle costs and a consistent real price basis are still needed for economic comparison.
Sources: annual report, pages 24 and 39; progress report, pages 6–7 and 43–44. This is a historical project reference, not a national construction timetable.
04 / From electricity to prosperity
The next question
is productive use.
Energy can support computing, manufacturing and resource processing. Household prosperity depends on what those activities produce, their full costs, ownership and the prices Canadians pay.
Build a portfolio we can test.
- Compare new generation, transmission, efficiency and industrial scheduling on equal service and cost bases.
- Measure reliable delivery, hydrology, network constraints, engineering capacity and equipment needs. Account for environmental effects, Indigenous rights and affected communities.
- Connect electricity to measured process output, quality and demand. Trace net income and price changes to households instead of assuming electricity becomes GDP or wealth.
05 / Sources, data and open questions
Make the reference
inspectable.
This is GLEE's analysis of reported primary sources. No field measurements, national forecast or engineering permission are claimed.
- BC Hydro 2025/26 annual report ↗Reported actual generation and year-end capacity: physical PDF page 137. Project costs: page 39. Accounting transfer period: page 24.
- Site C progress report, October 2025–March 2026 ↗Construction and commissioning: pages 6–7. Project cost components: pages 43–44. A regulatory filing is not itself a regulator's endorsement.
- Site C lessons executive summary, October 2025 ↗Long-run average energy and existing reservoir dependence: page 4. Project observations are not a universal hydro replication model.
Prepared by GLEE with OpenAI Codex assistance. The underlying benchmark reports 37 passing source, accounting and model checks. Separate-context AI source review and a follow-up dependency review found and corrected a fiscal-period error; these are not independent field verification or peer review. Exact source hashes, definitions and missing inputs are included in the data.